Welcome to our comprehensive guide on chart patterns and indicators in technical analysis. Whether you are a novice trader looking to learn the ropes or an experienced investor searching for new strategies, this article is for you. As the stock market becomes increasingly complex and unpredictable, it is crucial to have a solid understanding of technical analysis tools to make informed investment decisions.
In this article, we will dive deep into various chart patterns and indicators that can help you identify market trends, reversals, and potential entry/exit points. So, grab your notebook and prepare to enhance your trading skills as we explore the fascinating world of chart patterns and indicators in technical analysis.
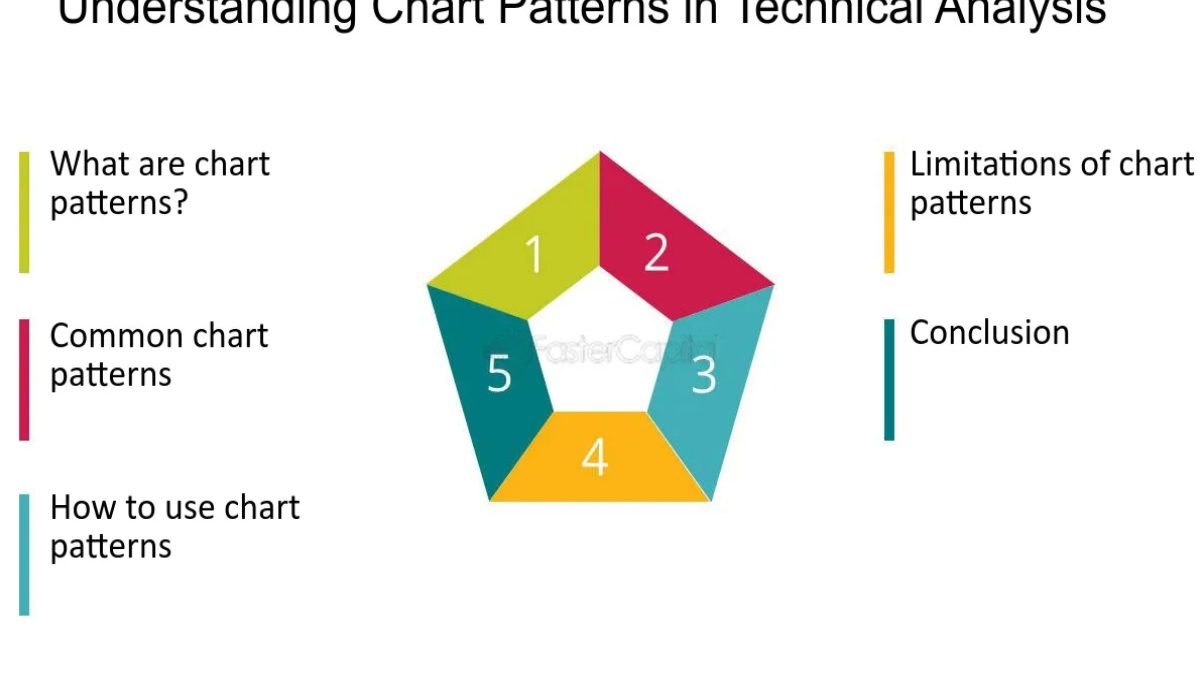
Table of Contents
What is Technical Analysis?
Before we delve into the fascinating world of chart patterns and indicators, let’s first establish a solid understanding of technical analysis. In its simplest form, technical analysis is a comprehensive method of evaluating stocks by meticulously analysing statistical trends and market activity. It includes dissecting price movements, trading volume, and other crucial market variables. Its underlying premise is rooted in the belief that historical price data can be harnessed to make informed predictions about future stock prices.
To effectively conduct technical analysis, one must diligently study charts, patterns, and indicators. By carefully scrutinising these visual representations, traders and investors can identify prevailing market trends and make well-informed trading decisions. Now that we have established a fundamental grasp of technical analysis, let’s explore the diverse types of chart patterns and indicators that can enhance our understanding of market dynamics. Check out Saxo Dubai market for more information on how to test out these technical indicators in live or simulated trading environment.
Chart Patterns
Chart patterns are distinctive formations created by the movement of security prices on a chart and are foundational elements in technical analysis. These patterns signify the continuation or reversal of trends and can be categorised into two main types: continuation patterns and reversal patterns. Continuation patterns suggest a pause in a current trend, after which the trend is likely to continue. Common continuation patterns include triangles, flags, and pennants, where a breakout usually follows the price consolidation in the direction of the preceding trend.
Reversal patterns indicate that the current trend may be about to change direction. Examples of reversal patterns comprise head and shoulders, double tops and bottoms, and cup and handle formations. Recognising these patterns requires experience and a keen eye, as they often signal significant market movements ahead. In addition to understanding chart patterns, traders must also be familiar with technical indicators that can further strengthen their analysis.
Technical Indicators
Technical indicators are calculations applied to a security’s price and volume data to expect future market movements. These tools help traders identify overbought or oversold conditions, trend strength, momentum shifts, and potential entry/exit points. Some popular indicators include Relative Strength Index (RSI), Moving Averages, and Bollinger Bands.
Moving Averages flat out price data by calculating the average price over a stated period. They help identify trends and potential support/resistance levels. RSI is an oscillator that measures the rapidity and change of price movements. Readings above 70 suggest overbought conditions, while readings below 30 indicate oversold conditions. Bollinger Bands contain of a simple moving average and two standard deviations plotted above and below the average. They help identify volatility and potential price breakouts.
What Are the Benefits of Using Chart Patterns and Indicators?
There are numerous benefits to incorporating chart patterns and technical indicators into your trading arsenal. Firstly, these tools help traders identify entry and exit points in the market, enabling them to make more knowledgeable decisions about when to buy or sell a security. They also assist in managing risk by highlighting critical support and resistance levels and identifying potential market reversals.
Furthermore, chart patterns and indicators can help traders filter out market noise and focus on critical price movements. It enables them to develop a disciplined and systematic approach to trading, leading to improved decision-making skills and potentially more profitable trades. In addition to their practical benefits, incorporating chart patterns and indicators into your trading strategy can increase your confidence in executing trades. By clearly understanding market trends and potential price movements, traders can feel more confident in their decision-making abilities.
What Are the Limitations of Using Chart Patterns and Indicators?
As with any technical analysis tool, chart patterns and indicators are limited. One drawback is that they are only sometimes accurate in predicting future market movements. Traders must understand that these tools are guides and should not be solely relied upon for trading decisions.
Furthermore, traders must also be aware of false signals, where a chart pattern or indicator may suggest a potential market movement, but the opposite occurs. It can lead to unused opportunities and losses if traders rely solely on these tools without considering other factors, such as fundamental analysis.

